It is evident from the above yearly budgets that the ecosystem is very sensitive
to changes in the environmental conditions (Malhi et al., 1999). The balance
between GPP and R![]() is responsible for the observed variability of
NEE. If GPP or R
is responsible for the observed variability of
NEE. If GPP or R![]() changes, both affects NEE and may lead to a situation
when NEE even changes sign. That means that the region should turn to be a net
source of CO
changes, both affects NEE and may lead to a situation
when NEE even changes sign. That means that the region should turn to be a net
source of CO![]() to the atmosphere. A warming climate in the Carpathian
Basin may enhance ecosystem respiration in an exponential fashion (see eq.
to the atmosphere. A warming climate in the Carpathian
Basin may enhance ecosystem respiration in an exponential fashion (see eq. ![]() ).
If it is not compensated with GPP (e.g. because of drought which causes high
VPD and low soil water content leading to reduced photosynthesis), NEE becomes
positive. If this happens, this behaviour may act as a positive feedback to
global warming.
).
If it is not compensated with GPP (e.g. because of drought which causes high
VPD and low soil water content leading to reduced photosynthesis), NEE becomes
positive. If this happens, this behaviour may act as a positive feedback to
global warming.
Calculating monthly sums of NEE, GPP and R![]() , we may try to find relationship
between the monthly mean climat variability and the variability in the measured
carbon fluxes.
, we may try to find relationship
between the monthly mean climat variability and the variability in the measured
carbon fluxes.
|
Mean annual air temperature was 9.1![]() C in 1997, 9.6
C in 1997, 9.6![]() C in
1998 and 9.6
C in
1998 and 9.6![]() C in 1999. Annual precipitation was 695.3 mm in 1997,
844.4 mm in 1998 and 784.9 mm in 1999. As it was described in table
C in 1999. Annual precipitation was 695.3 mm in 1997,
844.4 mm in 1998 and 784.9 mm in 1999. As it was described in table ![]() ,
total respiration in 1997 was lower than in the other years, while it was about
the same for 1998 and 1999. This can be explained by the lower annual average
temperature (see eq.
,
total respiration in 1997 was lower than in the other years, while it was about
the same for 1998 and 1999. This can be explained by the lower annual average
temperature (see eq. ![]() ). Mean air temperature was about the same in
1998 and 1999, which resulted in very similar respiration rates.
). Mean air temperature was about the same in
1998 and 1999, which resulted in very similar respiration rates.
In order to gain more insight into the processes governing the carbon balance,
we can investigate the relation between the monthly sums of NEE, R![]() and GPP, and the environmental forces.
and GPP, and the environmental forces.
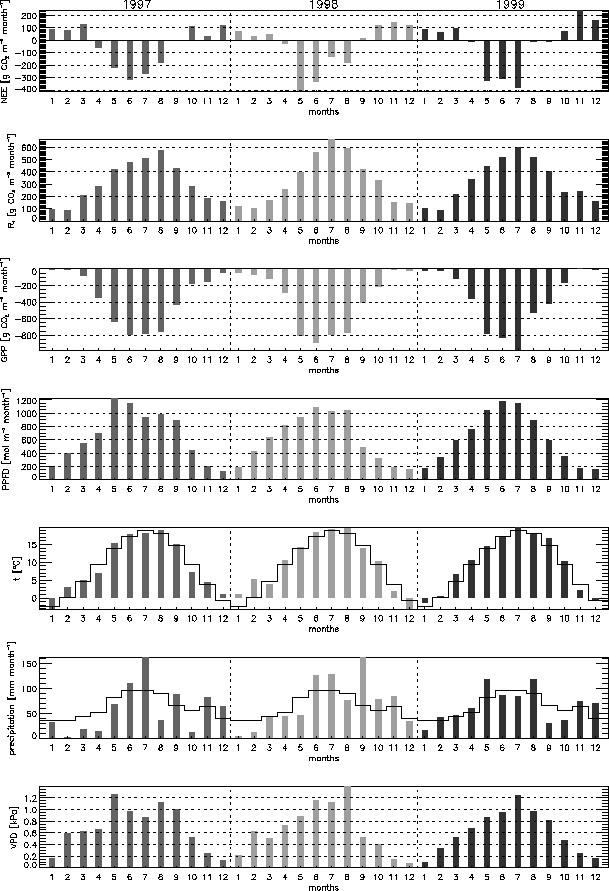
Figure ![]() shows (from top to bottom) the monthly sums of NEE,
R
shows (from top to bottom) the monthly sums of NEE,
R![]() , GPP (negative values represent carbon uptake by the vegetation),
and PPFD, the monthly average temperature and the monthly sums of precipitation
as measured by a nearby meteorological station (Szentgotthárd; the overplotted
solid line is the normal values between 1961 and 1990 for both plots), and the
monthly average daytime vapor pressure deficit for 1997, 1998 and 1999.
, GPP (negative values represent carbon uptake by the vegetation),
and PPFD, the monthly average temperature and the monthly sums of precipitation
as measured by a nearby meteorological station (Szentgotthárd; the overplotted
solid line is the normal values between 1961 and 1990 for both plots), and the
monthly average daytime vapor pressure deficit for 1997, 1998 and 1999.
We may deduce more linkage between the variability of the carbon fluxes in monthly
scale from figure ![]() .
.
Vapor pressure deficit does not seem to affect photosynthesis essentially. This
is demonstrated with July and August 1998. VPD during August was considerably
higher than during July, but rates of GPP was equal, which led to very similar
rates of GPP. As we saw it before in fig. ![]() , photosynthesis
is only affected by higher VPD values (VPD1.5 kPa), but not in
every cases. VPD may affect GPP in a daily or weekly scale, but it doesn't seem
to govern GPP in monthly or annual time scale.
, photosynthesis
is only affected by higher VPD values (VPD1.5 kPa), but not in
every cases. VPD may affect GPP in a daily or weekly scale, but it doesn't seem
to govern GPP in monthly or annual time scale.
Extreme events may be explained by other linkages. Since variability of NEE
is expected to be derived by its subcomponents, we seek relationships between
the climate forces and GPP and R![]() . GPP is expected to be controlled
by the monthly sums of PPFD. R
. GPP is expected to be controlled
by the monthly sums of PPFD. R![]() is mainly derived by temperature,
but soil CO
is mainly derived by temperature,
but soil CO![]() efflux may also be important. The following case studies
reflect the climate responses of the biosphere.
efflux may also be important. The following case studies
reflect the climate responses of the biosphere.
In August 1999 NEE was unusually low. This is caused by the lower rates of PPFD which is resulted in lower GPP (compared to other years). Low PPFD is tied to the excess precipitation (cloudiness). In contrast, during July 1999 NEE was quite large. This is caused by the high rates of GPP compared to GPP measured during July 1997 and 1998.
High respiration sum occured during July 1998. This is caused by above average precipitation during average temperature conditions which supports microbial respiration in the soil. In contrast, during July 1997 above average precipitation occured together with below average temperature. This results in normal respiration rates.
High NEE occured during May 1998 which is caused by reduced respiration. This can be explained by the occurence of average temperature (during July 1997 and 1999 temperature was above average) and normal GPP.
We should note that not every extreme monthly event can be explained by such reasoning.
All of the above confirms the complexity of linkages between NEE and the environmental factors. The sensitivity of carbon sequestering ability of the region is also evident from the data. Further measurements are needed to confirm the observed linkages and to find others, and to provide forecasts about the carbon balance of the region under a changing climate (IPCC website, 2001).