Next: Data preparation
Up: Data processing
Previous: Data processing
Contents
Averaging time
The appropriate averaging time to be used can be determined by the use of an
ogive function (Foken and Wichura, 1996). This function is defined as the cumulative
integral of the cospectra beginning with the highest frequencies. The cospectra
of scalar  and
and  is defined as follows: let F
 and
F
and
F be the discrete Fourier transform of the simultaneously measured
scalars and , respectively. Let
be the discrete Fourier transform of the simultaneously measured
scalars and , respectively. Let
 and
and
 , where subscripts
  and
and  denote
real and imaginary parts of the discrete Fourier transform, respectively. The
cospectrum is defined as
denote
real and imaginary parts of the discrete Fourier transform, respectively. The
cospectrum is defined as
 |
(2.42) |
(Stull, 1988). It is important to note that the sum over frequency of all cospectral
amplitudes,  , equals the covariance between and .
The ogive function has a form of
, equals the covariance between and .
The ogive function has a form of
 |
(2.43) |
for any scalar flux
 , where
  denotes natural frequency
and
denotes natural frequency
and  is the lowest frequency contributing to the integral. This
ogive function converges to a constant value at a frequency which could be converted
to the averaging time.
is the lowest frequency contributing to the integral. This
ogive function converges to a constant value at a frequency which could be converted
to the averaging time.
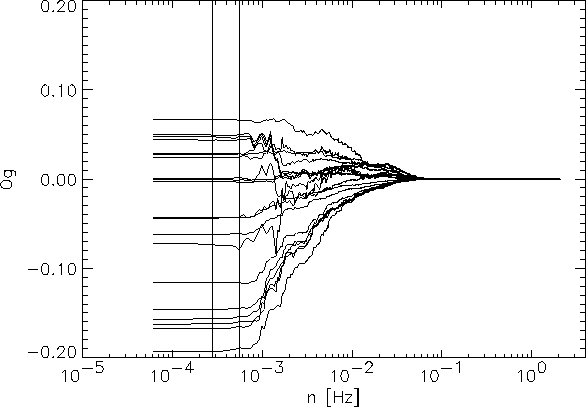
Figure:
Carbon dioxide ogives (Og) based on 4.5 h periods, during
5 August, 1997. The vertical lines correspond to time periods of 1 and 0.5 h.
|
|
Figure ![[*]](http://nimbus.elte.hu/icons/latex2html/crossref.gif) shows the ogive functions for one day based on continuous
4.5 hours long time series. It can be seen that 0.5 hours averaging time is
neary appropriate, but for precision 60 minutes averaging time was chosen to
determine turbulent fluxes. We should note that closer to the surface 30 min
averaging time is widely used in micrometeorology. Since turbulent scales become
larger if we move away from the surface, a longer averaging time is required
to resolve the low frequency part of the fluctuations which contributes to the
turbulent transport. Also, the ogives show that 4 Hz sampling frequency is more
than enough to resolve the high frequency scales contributing to the turbulent
transport at the height of the measurement.
shows the ogive functions for one day based on continuous
4.5 hours long time series. It can be seen that 0.5 hours averaging time is
neary appropriate, but for precision 60 minutes averaging time was chosen to
determine turbulent fluxes. We should note that closer to the surface 30 min
averaging time is widely used in micrometeorology. Since turbulent scales become
larger if we move away from the surface, a longer averaging time is required
to resolve the low frequency part of the fluctuations which contributes to the
turbulent transport. Also, the ogives show that 4 Hz sampling frequency is more
than enough to resolve the high frequency scales contributing to the turbulent
transport at the height of the measurement.
Next: Data preparation
Up: Data processing
Previous: Data processing
Contents
root
2001-06-16