The system was designed to enable us to calculate vertical flux of carbon dioxide from the long term profile measurements. The critical evaluation of the accuracy with which the fluxes can be determined will be given later.
Estimates of the vertical mass transport of CO![]() and other scalars
at the surface can be obtained by using surface layer (the lowest 10% of the
planetary boundary layer) similarity theory (e.g., see Dyer and Hicks, 1970;
Businger et al., 1971; Foken and Skeib, 1983; Businger, 1986; Stull, 1988; Yagüe
and Cano, 1994; Saigusa et al., 1998; Hensen et al., 1997; Weidinger et al.,
2000), if the vertical profiles of wind speed and air temperature are also available.
Applicability of the similarity theory has several preconditions (see Foken
and Wichura, 1996 for detailed overview). Briefly, the turbulent field must
be horizontally homogeneous and stationary with an appropriate homogeneous area
up to a distance of approximately
and other scalars
at the surface can be obtained by using surface layer (the lowest 10% of the
planetary boundary layer) similarity theory (e.g., see Dyer and Hicks, 1970;
Businger et al., 1971; Foken and Skeib, 1983; Businger, 1986; Stull, 1988; Yagüe
and Cano, 1994; Saigusa et al., 1998; Hensen et al., 1997; Weidinger et al.,
2000), if the vertical profiles of wind speed and air temperature are also available.
Applicability of the similarity theory has several preconditions (see Foken
and Wichura, 1996 for detailed overview). Briefly, the turbulent field must
be horizontally homogeneous and stationary with an appropriate homogeneous area
up to a distance of approximately ![]() (where
(where ![]() is the measuring
height) around the measuring site.
is the measuring
height) around the measuring site.
In our case, the unusually large height differences between the measuring levels cause uncertainty in the estimate of the similarity profiles but also contributes to improved estimates of the (often small) mixing ratio and temperature gradients. Difficulty arises during nighttime stable conditions when we are restricted to use data measured by the two lowest levels (10 m and 48 m) for the estimate of fluxes to ensure that the utilized data reside in the surface layer (Stull, 1988; Yagüe and Cano, 1994). During unstable conditions we use data of the three lowest levels, up to 82 m height. At night, the 82 m level is often above the inversion layer, and so it is completely decoupled from the ground. Also, the precondition of homogeneous fetch is not fulfilled in our case. Consequently, the results acquired from the similarity theory are expexted to have errors.
As there are three measuring levels located inside the surface layer during unstable conditions, the surface layer fluxes can be inferred using profile fitting technique instead of the less precise flux-gradient relationships which utilize data from only two levels.
According to the Monin-Obukhov similarity theory, the non-dimensional wind,
temperature, and scalar profiles can be expressed in the horizontally homogeneous
and stationary surface layer as:
or with the integrated forms as :
with
It is generally accepted that
![]() since for both potential
temperature and other scalars the turbulent exchange is governed by the same
turbulent field thus the physical process of the transport is similar.
since for both potential
temperature and other scalars the turbulent exchange is governed by the same
turbulent field thus the physical process of the transport is similar.
The functional forms of ![]() and
and ![]() are determined
by field measurements (Högström, 1988). Due to the large scatter of
the experimental data many different functions can be found in the literature
(e.g. Dyer, 1970; Businger et al., 1971; Foken and Skeib, 1983; Högström,
1988, 1996; Weidinger et al., 2000). For our purposes the revised similarity
functions of Högström (1996) are used, which are best fits to large
quantities of experimental data. For unstable situations these are as follows:
are determined
by field measurements (Högström, 1988). Due to the large scatter of
the experimental data many different functions can be found in the literature
(e.g. Dyer, 1970; Businger et al., 1971; Foken and Skeib, 1983; Högström,
1988, 1996; Weidinger et al., 2000). For our purposes the revised similarity
functions of Högström (1996) are used, which are best fits to large
quantities of experimental data. For unstable situations these are as follows:
Functions ![]() and
and ![]() are as follows for unstable
conditions (
are as follows for unstable
conditions (![]() ) after Benoit (1977):
) after Benoit (1977):
For stable conditions (![]() ):
):
Note that ![]() =
=![]() since
since
![]() .
.
Before the application of the profile fitting technique, wind direction dependent
roughness length (![]() ) is determined dividing the wind directions into
120 sectors (analogous to the wind direction classification of the eddy covariance
system, see chapter
) is determined dividing the wind directions into
120 sectors (analogous to the wind direction classification of the eddy covariance
system, see chapter ![]() ). The idea behind the calculation
method is that surface layer fluxes can also be inferred from measurements taken
at only two levels using flux-gradient relationships instead of the more precise
flux-profile method. Flux-gradient relationships do not utilize
). The idea behind the calculation
method is that surface layer fluxes can also be inferred from measurements taken
at only two levels using flux-gradient relationships instead of the more precise
flux-profile method. Flux-gradient relationships do not utilize ![]() since during the iteration the values of
since during the iteration the values of ![]() and
and ![]() are determined from two level's data thus
are determined from two level's data thus ![]() is rejected (e.g. considering
eq.
is rejected (e.g. considering
eq. ![]() for two different levels and substracting them will lead to an
equation which does not contain
for two different levels and substracting them will lead to an
equation which does not contain ![]() ). After
). After ![]() and
and ![]() had been determined eq.
had been determined eq. ![]() can be used to determine
can be used to determine ![]() for
a specific height, wind direction and wind speed:
for
a specific height, wind direction and wind speed:
Values of ![]() are determined from the long term profile measurements
classified by wind direction. Data measured during unstable atmospheric conditions
are used, utilizing wind speed data from 48 m and 10 m. The calculated
are determined from the long term profile measurements
classified by wind direction. Data measured during unstable atmospheric conditions
are used, utilizing wind speed data from 48 m and 10 m. The calculated ![]() values are averaged in 3 degree intervals of the wind direction. Because of
the huge scatter of data, only one average
values are averaged in 3 degree intervals of the wind direction. Because of
the huge scatter of data, only one average ![]() is used in each sector
through the years. The average roughness length is 0.15 m, the minimum value
is 0.06 m, and the maximum is 0.24 m.
is used in each sector
through the years. The average roughness length is 0.15 m, the minimum value
is 0.06 m, and the maximum is 0.24 m.
For zero plane displacement ![]() m is used considering that the measuring
tower is surrounded by arable land presumably with low vegetation. It should
be noted that the calculations are not sensitive to the choice of
m is used considering that the measuring
tower is surrounded by arable land presumably with low vegetation. It should
be noted that the calculations are not sensitive to the choice of ![]() since
the measuring levels are located relatively high above the vegetation (Weidinger
et al., 2000).
since
the measuring levels are located relatively high above the vegetation (Weidinger
et al., 2000).
The algorithm of calculation is as follows.
First the bulk Richardson number is determined based on data measured by the
two lowest level (Yagüe and Cano, 1994; Stull, 1988):
Then, it is determined whether the situation was stable or unstable based on
the potential temperature profile. This could be decided based on the bulk Richardson
number, but the temperature profile may differ from the theoretical, strictly
monotonous change with height especially during the morning transition period
from stable to unstable stratification, thus at higher altitudes (e.g. at 82 m)
the temperature value may not fit the lapse rate determined by the two lowest
level. Also, during daytime, well-mixed conditions, the temperature profile
is close to the dry adiabatic lapse rate (0.0098 K m![]() ), which means
that small fluctuations of the average temperature at one level can cause deviations
from the strictly monotonous profiles.
), which means
that small fluctuations of the average temperature at one level can cause deviations
from the strictly monotonous profiles.
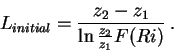
Next, initial Obukhov length is estimated which is required to start the iteration.
If the conditions are unstable ![]() is calculated based on the
definition of the Obukhov length (eq.
is calculated based on the
definition of the Obukhov length (eq. ![]() ) fitting to pure logarithmic
profiles for a neutral atmosphere:
) fitting to pure logarithmic
profiles for a neutral atmosphere:
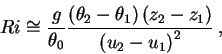
During stable conditions, ![]() is estimated from the bulk Richardson
number (Yagüe and Cano, 1993) using Businger's similarity function (Businger,
1971):
is estimated from the bulk Richardson
number (Yagüe and Cano, 1993) using Businger's similarity function (Businger,
1971):
and
Iteration is starting with the ![]() value, using the least squares
fit technique described above to obtain
value, using the least squares
fit technique described above to obtain ![]() ,
, ![]() and
and
![]() using equations
using equations ![]() and
and ![]() to determine the
to determine the
![]() and
and ![]() values for the line fitting (instead of eq.
values for the line fitting (instead of eq. ![]() and
and ![]() ). Again, the intercepts of the fitted lines are forced to be
zero, and the slopes of the lines determine
). Again, the intercepts of the fitted lines are forced to be
zero, and the slopes of the lines determine ![]() and
and ![]() .
A new
.
A new ![]() is calculated in each step from the new
is calculated in each step from the new ![]() and
and ![]() values. As it was mentioned in the beginning of this chapter, for unstable conditions
data measured by the lowest 3 levels are utilized for the fitting (10 m, 48 m
and 82 m), and for stable conditions data measured by the two lowest levels
are used to ensure that only data measured inside the surface layer is used.
values. As it was mentioned in the beginning of this chapter, for unstable conditions
data measured by the lowest 3 levels are utilized for the fitting (10 m, 48 m
and 82 m), and for stable conditions data measured by the two lowest levels
are used to ensure that only data measured inside the surface layer is used.
The iterative method consists of comparing the new ![]() with the previously
calculated one. Iteration finishes when the difference between two consecutive
with the previously
calculated one. Iteration finishes when the difference between two consecutive
![]() values is less then 1% of the current Obukhov length, or after 30
iteration steps.
values is less then 1% of the current Obukhov length, or after 30
iteration steps.
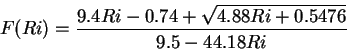
During stable conditions the iteration can fail, due the strong stability. If
this is the case, the analytical solution of Lee (1997) is used if the bulk
Richardson number is less than 0.2. In other cases turbulence is supressed or
tends to be intermittent, so the similarity theory is no longer applicable.
The formulae of Lee is the following:
In case of successful iteration or analytical solution, the water vapor dry
air mixing ratio (![]() , given in g/kg dry air) and carbon dioxide dry air
mixing ratio (
, given in g/kg dry air) and carbon dioxide dry air
mixing ratio (![]() , given in ppm, which is equivalent with
, given in ppm, which is equivalent with ![]() mol/mol
dry air) profiles are used to estimate
mol/mol
dry air) profiles are used to estimate ![]() and
and ![]() with the
line fitting method described above using eq.
with the
line fitting method described above using eq. ![]() .
.
Finally, the scales are converted to usual physical fluxes:
Since profile measurements are performed in every 8 or 10 minutes (see section
![]() ), the fluxes calculated from each available individual measurement
are averaged to 60 minutes.
), the fluxes calculated from each available individual measurement
are averaged to 60 minutes.
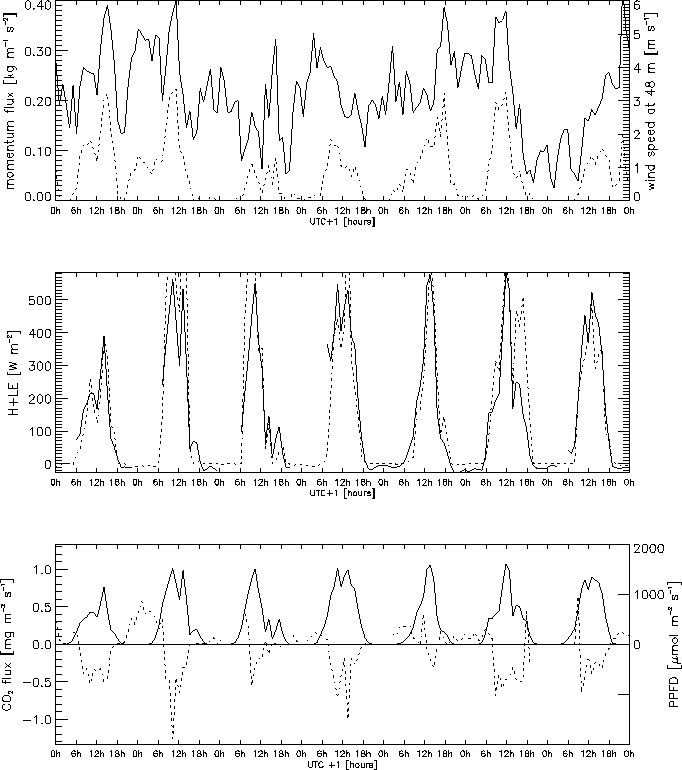
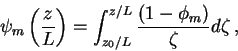
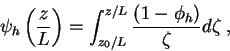
Figure ![]() shows one week of profile data together with some
meteorological elements.
shows one week of profile data together with some
meteorological elements.
|

![\begin{displaymath}
\psi _{m}=\ln \left[ \left( \frac{1+x}{2}\right) ^{2}\left( ...
...}\right) \right] -2\arctan \left( x\right) +\frac{\pi }{2}\: ,
\end{displaymath}](img81.gif)
![\begin{displaymath}
z_{0}=z\exp \left[ -\frac{uk}{u_{*}}-\psi _{m}\left( \frac{z}{L}\right) \right] \: .
\end{displaymath}](img90.gif)
![\begin{displaymath}
\frac{z}{L}=\frac{\frac{z}{z-z_{0}}\ln \left( \frac{z}{z_{0}...
...{2}}}\right] }{2\frac{\beta }{R}\left( \beta Ri-1\right) }\: ,
\end{displaymath}](img105.gif)